Quartet Analytics
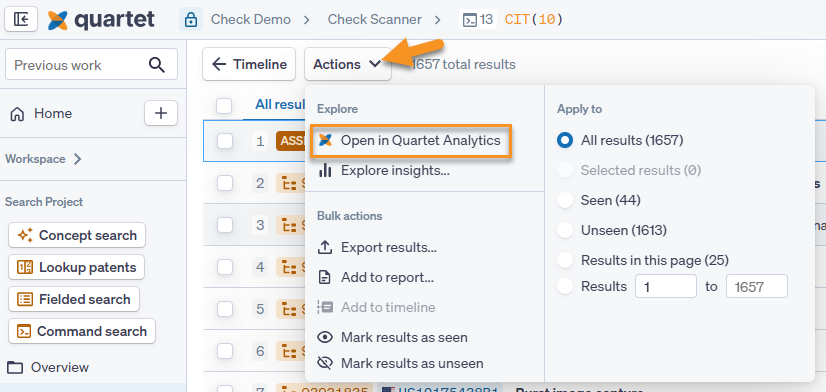
Quartet Analytics can be used to view charts, graphs, and a timeline of any data set, up to 10,000 results. This data set can be chosen from any of the run search strings and can be accessed both from the timeline
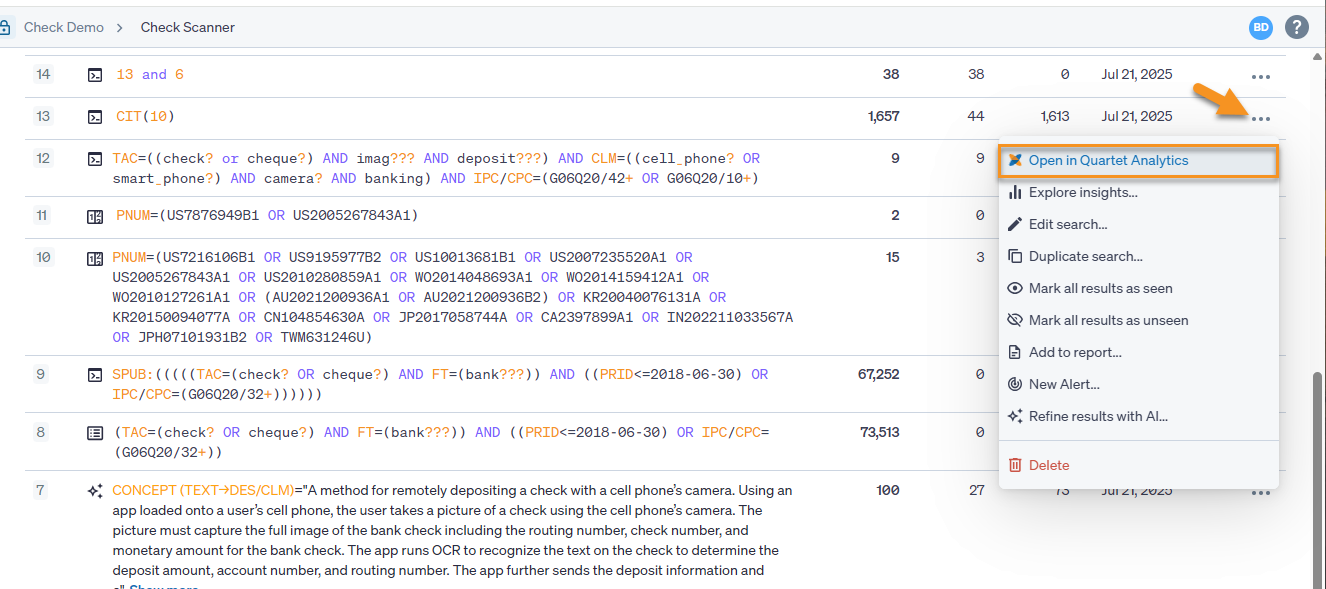
as well as from the results view.
Quartet Analytics Overview
Quartet Analytics will launch in a new browser tab, taking you to the landing screen
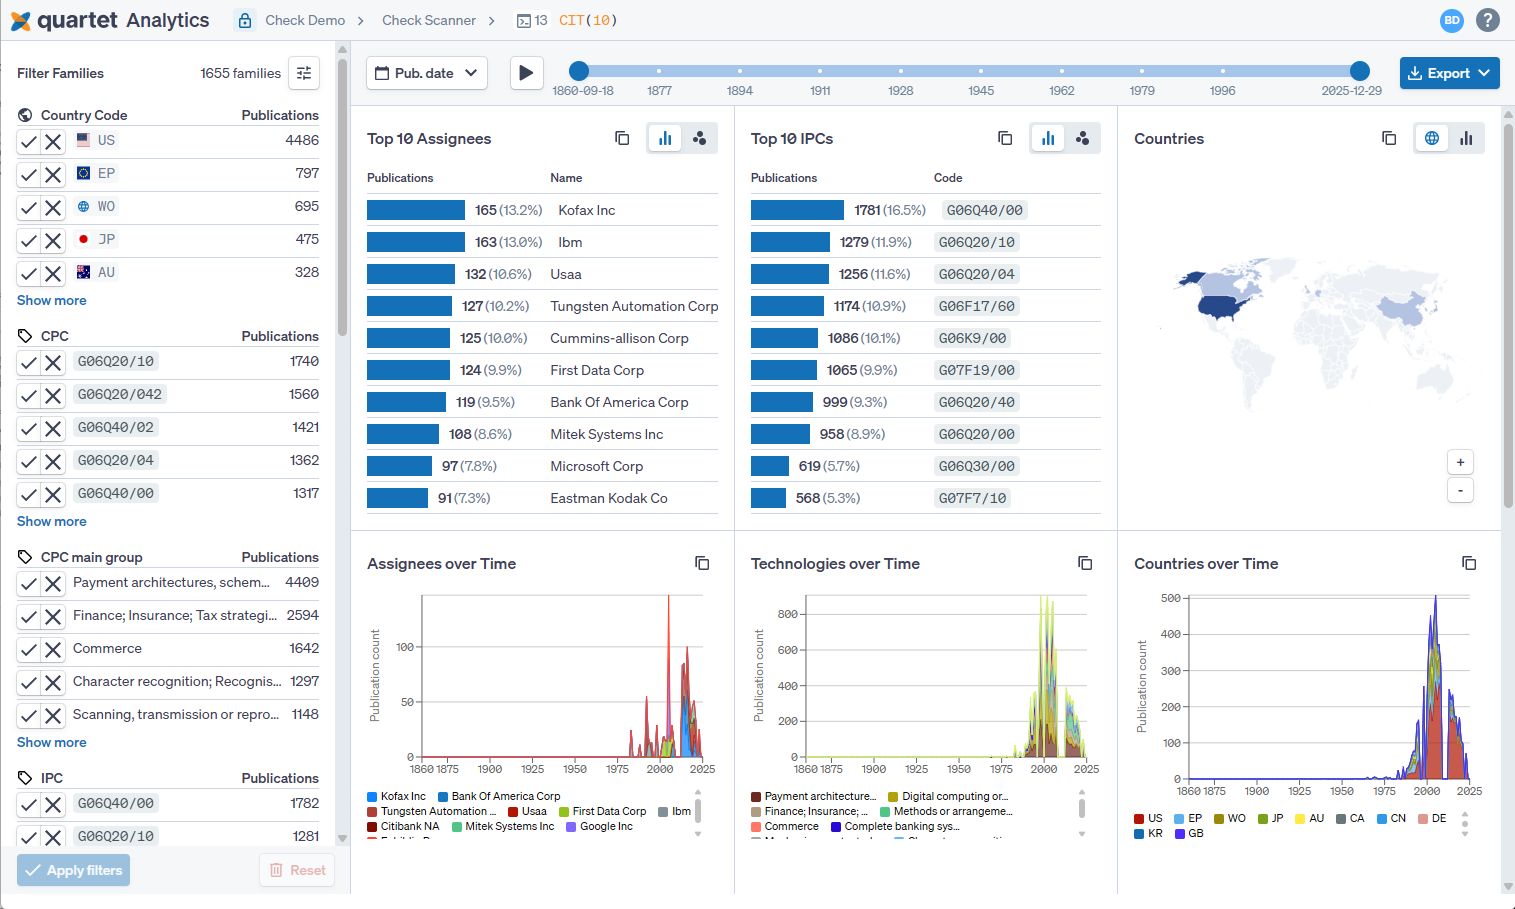
The main screen has two panes, the left pane controls filters, while the right shows the information in all of its charts. At the top is a timeline, allowing a specific date range to be set, and an associated drop down filter, which allows for more precise selection of date filtering and what type of date to use, and finally a play button, which starts a play-by-play of each date range, showing how the charts change through time.
Filters
Filters are located on the left pane, and can be used to refine results or see patterns within certain subgroups. The filters can work in both directions, with the removing and the
limiting to those categories. Important to note that the
removal is on a family basis, so picking the
filter on the DE country code will remove any family with a single DE member. Usually it is more accurate to use the
filter to build up what you want to see. Once the selections are made, clicking
at the bottom will apply the chosen filters.
Charts
The right panel displays charts showcasing the data associated with the selected patents. The shown charts are
- Assignees
- International Patent Classification codes
- Countries
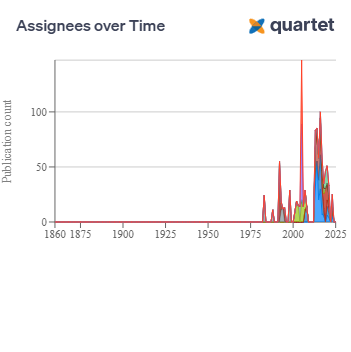
- Assignees over Time
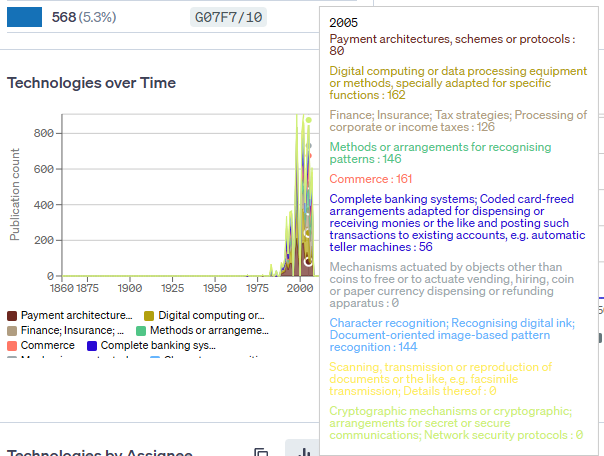
- Technologies over Time
- Countries over Time
- Assignees by Technology
- Technologies by Assignee
- Countries by Assignee
- Assignees by Country
- Technologies by Country
- Countries by Technology
Certain charts my be toggled between bar and cluster charts by using the button on the top right
Information may be more easily read by hovering the cursor over different parts of the chart.
Additionally, the chart image my be copied with the copy button, and that image may be pasted anywhere. To copy a chart hit the copy button in the top right